Institutional Insights: Societe Generlae ¨All that glitters is fear: Gold's ascent to $5000'
All that shines is fear: the rise of gold towards $5,000/oz seems more likely than ever. Last week, gold prices hit $4,042/oz, only $276/oz shy of our optimistic Q426 forecast of $4,318/oz released just a month prior (here). As of this morning, prices have climbed to $4,072/oz. With strong ETF inflows and a resilient outlook for central bank purchases, we feel assured in revising our gold price targets upward. We now anticipate prices may reach $5,000/oz by the end of 2026, as the rate of inflows has exceeded our earlier projections. Although we lack clear insight into hedge fund positioning, we have noticed what can only be characterized as an exceptionally robust and unexpectedly high positive trend in recent ETF inflows.
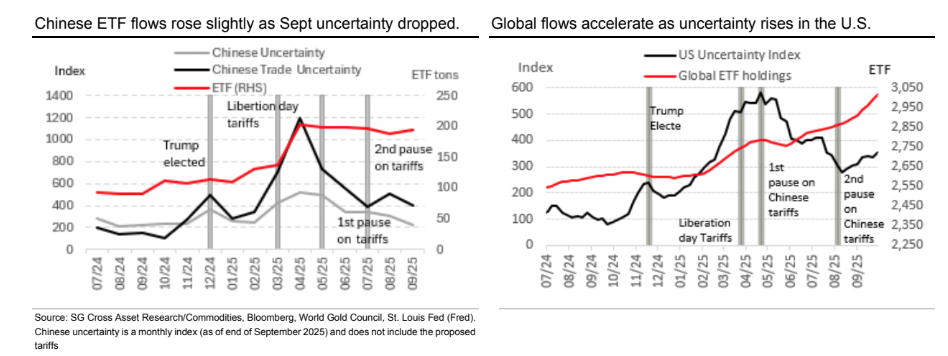
What is driving this surge in inflows at this time? We have previously identified a strong correlation between ETF flows and uncertainty levels since Donald Trump’s election victory in November 2024, and we believe this remains a vital factor in interpreting part of the price movements. Acknowledging that some uncertainty indices (here) are published on a monthly schedule, they likely overlooked significant events, such as China announcing sweeping export restrictions on rare earth materials on October 9th (the Chinese uncertainty index was calculated using data available only until the end of September). This index also does not reflect that last Friday, President Trump declared an additional 100% tariff on all Chinese goods while simultaneously showing willingness to negotiate a deal to ease trade tensions.
Nonetheless, when we take a broader view of recent developments, we observe that in China, general (and trade) uncertainty indices dropped by 80 (100) points throughout September, yet ETF gold holdings in China increased to approximately 193 tons from 189 tons
In the meantime, utilizing our favored weekly U.S. uncertainty index, which reflects the time when China imposed rare earth export controls and Trump's recent reaction, the uncertainty level surged to 354—indicating an 18-point rise within the week and a total increase of 44 points over the month (refer to the upper right graphic). This index level of 354 is still three times higher than the level seen in the five months leading up to the U.S. election. Not unexpectedly, global ETF flows grew by 23 tons in the past week and have shown a remarkable 100 tons increase over the last month alone. However, our China economics team noted on Sunday (see here) that there is less than a 30% probability of the new tariffs being implemented, yet these potential scenarios tend to drive substantial inflows into gold ETFs. We cannot foresee a return to the pre-Trump index of uncertainty normalcy during our forecast period, making ETF flows a crucial element in our price predictions.
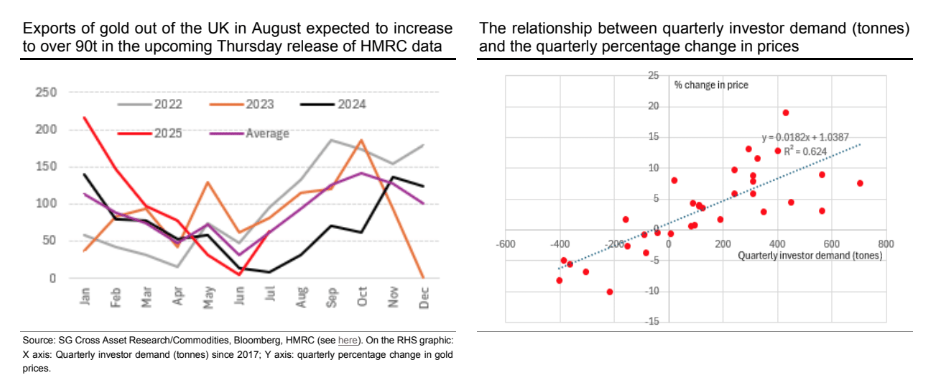
Shifting to our forecasting framework, we continue to uphold the assumptions we detailed in the September outlook published just four weeks ago. In that outlook, we made the case for exceptionally strong demand from gold investors and central banks, pointing out that since 2022, the average quarterly increase in flows has been 72.5 tons across all managed money, ETFs, central banks, and demand for coins and bars. Specifically for ETFs, (where we currently have access to nearly real-time data on flows), the quarterly changes have averaged +31.5 tons since 2017. It is notable that this quarter (up to the end of September), we have observed an impressive 100 tons of inflows into global gold ETFs, which is 69 tons above what is considered “normal.” This flow alone partially accounts for the significantly higher gold price during September. These elevated ETF inflows, the highest level recorded since Q3 2020 (when we saw 238 tons of positive flows), exceed our initial flow predictions and, according to our model, contribute approximately $160 per ounce to the increase in gold prices over the past three months.
We persist in taking a careful and prudent approach to forecasting gold flows, assuming an additional purchase of 67 tons of gold each quarter beyond typical levels across all flow categories (such as central banks, ETFs, etc.) throughout all quarters. This approach remains, even in the face of heightened uncertainty, as we believe that central banks increase their gold holdings to improve the percentage in their total reserves. Consequently, we incorporate this extra amount into our average demand, which is reflected in the model framework illustrated in the upper-right chart for price forecasting through the end of 2026 (our forecasting period). When we recalibrate our gold framework based on the current gold price (i.e., adjusting the base price to market value while maintaining our assumptions), the model suggests a target of $4,217/oz by the end of 2025 and $5,000/oz by the end of 2026, representing a 14% rise from our previous estimate of $4,300/oz released in September.
Based on conservative estimates regarding ETF and central bank flows, we believe the potential for an upside in our forecast is notably higher than the downside risk. Additionally, regarding data announcements, the UK HMRC customs data will be released this Thursday. This data is essential for tracking gold exports from the UK. Last month, which included exports from July, totalled 63 tons, matching the average for that month over the past four years. We anticipate a continued seasonal increase in exports, projecting an average rise to 93 tons throughout August, which should further bolster prices.
Disclaimer: The material provided is for information purposes only and should not be considered as investment advice. The views, information, or opinions expressed in the text belong solely to the author, and not to the author’s employer, organization, committee or other group or individual or company.
Past performance is not indicative of future results.
High Risk Warning: CFDs are complex instruments and come with a high risk of losing money rapidly due to leverage. 71% and 74% of retail investor accounts lose money when trading CFDs with Tickmill UK Ltd and Tickmill Europe Ltd respectively. You should consider whether you understand how CFDs work and whether you can afford to take the high risk of losing your money.
Futures and Options: Trading futures and options on margin carries a high degree of risk and may result in losses exceeding your initial investment. These products are not suitable for all investors. Ensure you fully understand the risks and take appropriate care to manage your risk.
Patrick has been involved in the financial markets for well over a decade as a self-educated professional trader and money manager. Flitting between the roles of market commentator, analyst and mentor, Patrick has improved the technical skills and psychological stance of literally hundreds of traders – coaching them to become savvy market operators!