S&P500 Daily Action Areas & Price Targets

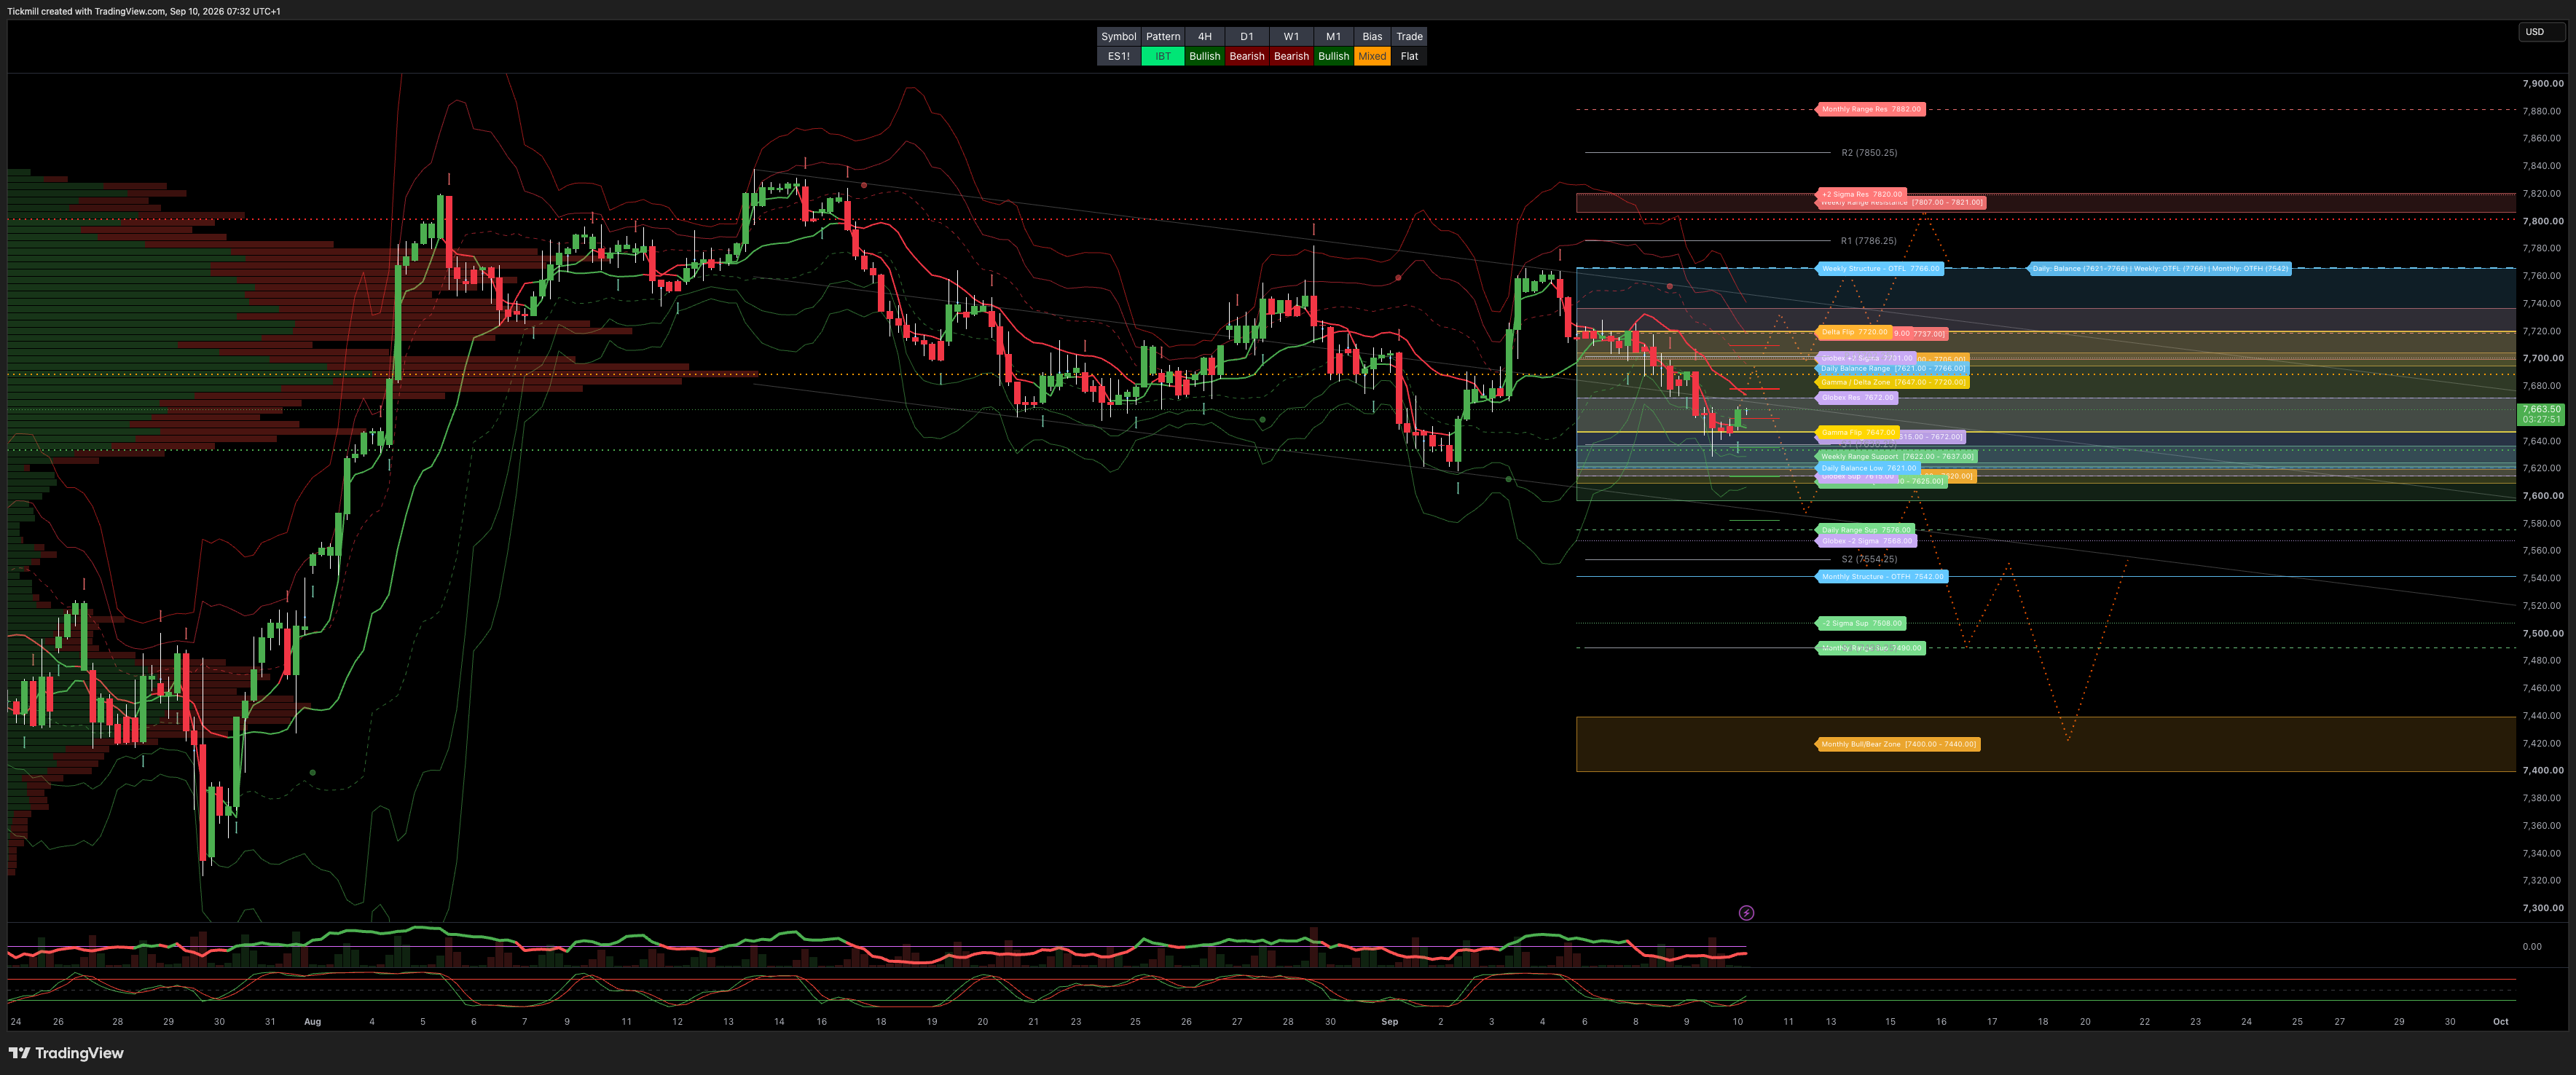
S&P500 Daily Action Areas & Price Targets 10/9/26
***QUOTING ES1! FOR CASH US500 EQUIVALENT LEVELS, SUBTRACT POINT DIFFERENCE***
MONTHLY-WEEKLY& DAILY LEVELS
MONTHLY BULL BEAR ZONE 7440/7400
MONTHLY RANGE RES 7882 SUP 7490
WEEKLY BULL BEAR ZONE 7620/10
WEEKLY RANGE RES 7821/07 SUP 7637/22
DAILY BULL BEAR ZONE 7695/7705
DAILY RANGE RES 7719 SUP 7576
2 SIGMA RES 7820 SUP 7508
GLOBEX RANGE RES 7672 SUP 7615
2 SIGMA RES 7701 SUP 7568
GAMMA FLIP 7647
DELTA FLIP 7720
PUT WALLS 7597/7625
CALL WALLS 7700/7737
GAP FILL 7766.25
DAILY STRUCTURE - BALANCE - 7766/7621
WEEKLY STRUCTURE - OTFL - 7766
MONTHLY STRUCTURE - OTFH - 7542
VIX BULL BEAR ZONE 17.3 (VVIX / VIX) 5.51
PRIMARY TRADES & TARGETS
SHORT ON REJECT/RECLAIM DBBZ TARET DAILY RANGE SUP
LONG ON ACCEPTANCE ABOVE DBBZ TARGET DAILY RANGE RES
***ADDITIONAL SETUPS & TARGETS HIGHLIGHTED ON THE CHARTS***
(I FADE TESTS OF 2 SIGMA LEVELS ESPECIALLY INTO THE FINAL HOUR OF THE NY CASH SESSION AS 90% OF THE TIME WHEN TESTED THE MARKET WILL CLOSE ABOVE OR BELOW THESE LEVELS)
SPX PUT/CALL RATIO 1.16 (The numbers reflect options traded during the current session.) A put-call ratio below 0.7 is generally considered bullish, and a put-call ratio above 1.0 is generally considered bearish.
JHEQX Q3 Collar Short Call Cap: ~7,750 – 7,900 - Long Put Strike: ~7,050 – 7,100 (approx. 5% downside protection) Short Put Strike: ~5,950
DEC2025 OPEX to DEC2026 OPEX is 945 points giving us a range of [5889,7779]
Notes On Structure Implications
Balance: This refers to a market condition where prices move within a defined range, reflecting uncertainty as participants await further market-generated information. Our approach to balance includes favouring fade trades at the range extremes (highs/lows) while preparing for potential breakout scenarios if the balance shifts.
One-Time Framing Higher (OTFH): This represents a market trend where each successive bar forms a higher low, signalling a strong and consistent upward movement.
One-Time Framing Lower (OTFL): This describes a market trend where each successive bar forms a lower high, indicating a pronounced and steady downward movement.
GOLDMAN SACHS FICC & EQUITY TRADING DESK VIEWS
EQUITY & VOL DESK BRIEFING: US MARKETS
Author: Lilly Belt (Goldman Sachs Analyst, FICC & Equities) | Date: September 9, 2026
THE TAKE: YIELDS & OIL DRAG TAPE LOWER IN BREADTH UNWIND
US equities closed lower for a second consecutive session as US 10-Year and 20-Year yields surged back to their highest levels since 2023 (10Y +5.0 bps to 4.8386%). The catalyst was a US Treasury buyback announcement that came in "just" inline with expectations, failing to relieve rate pressure. Combined with WTI Crude closing >$100/bbl (+411 bps to $96.85) due to an escalating Middle East backdrop with no diplomatic exit ramp, higher input costs and discount rates heavily weighed on Consumer and Cyclical names.
Market breadth was notably poor, with 404 S&P 500 constituents closing in the red—the weakest breadth footprint since June 17th. Institutional activity levels were moderate (4/10 floor rating), with Hedge Funds finishing flat and Long-Onlys ending as net buyers driven by healthcare demand and macro product inflows.
MARKET SUMMARY & ASSET MATRIX
Asset / Index | Closing Level / Price | Session Change | Volatility / Key Metrics | Institutional & Desk Flow |
S&P 500 (SPX) | 7,636.00 | -0.48% | Implied move through tomorrow: 0.55% | MOC: $265M to SELL; Skew buyers on dip |
Nasdaq-100 (NDX) | 29,421.00 | -0.29% | Vol bid in front and belly | META standout winner (Muse); AI trade mixed |
Russell 2000 (RUT) | 2,921.00 | -1.32% | Fixed strike vol offered in belly/back | Rate-sensitive small-cap underperformance |
Dow Jones (DJI) | 52,380.00 | -0.77% | - | Downside drag from Cyclicals & Consumer |
US 10Y Treasury | 4.8386% | +5.0 bps | Highest levels since 2023 | TLT short-dated upside calls bought on rate sell-off |
WTI Crude | $96.85 | +4.11% | Closed >$100 intraday | Macro supply shock driving inflation pressure |
Gold | $4,396.00 | +0.92% | Safe-haven bid holding strong | Sustained demand amid rate/oil volatility |
Bitcoin | $78,256.00 | -0.28% | - | Range-bound price action |
CBOE VIX | 16.46 | +4.71% | Fixed strike vol trickled higher | Gamma bid in front end |
GS COMMUNACOPIA & TMT CONFERENCE INSIGHTS
Commerce x Agentic AI (Etsy Insights): Day 2 of the GS Communacopia & Technology Conference highlighted the emerging debate around AI's impact on e-commerce discovery.
Inventory & Intent Matching: Etsy framed AI as a structural growth catalyst rather than a disintermediation threat. Deeper LLM integration has improved marketplace inventory matching, surfacing personalized listings and boosting buyer conversion.
Agentic Commerce Pipeline: Etsy confirmed active partnerships with 3rd-party LLM platforms to ensure inventory discoverability in agentic shopping workflows. While agentic traffic remains small, conversion intent is running high, positioning agentic tools as complementary to traditional search journeys.
DERIVATIVES & FLOW COLOR
SPX & NDX Volatility: SPX front-end fixed strike vol trickled higher alongside spot weakness. NDX vol outperformed as the index held up better, with bids across both front and belly tenors. Skew was bid along the curve for both major indices.
RUT Volatility: RUT fixed strike vol was offered in the belly and back-end tenors, with light bid interest limited strictly to gamma tenors.
Tactical Flow Highlights:
Semis Upside: Large short-dated upside call buying went through across Semiconductor names surrounding TMT conference headlines.
TLT Call Demand: Following the Treasury buyback release, shorter-dated upside calls were bought in TLT to position for a potential pullback in long-end yields.
Disclaimer: The material provided is for information purposes only and should not be considered as investment advice. The views, information, or opinions expressed in the text belong solely to the author, and not to the author’s employer, organization, committee or other group or individual or company.
Past performance is not indicative of future results.
High Risk Warning: CFDs are complex instruments and come with a high risk of losing money rapidly due to leverage. 69% and 73% of retail investor accounts lose money when trading CFDs with Tickmill UK Ltd and Tickmill Europe Ltd respectively. You should consider whether you understand how CFDs work and whether you can afford to take the high risk of losing your money.
Futures and Options: Trading futures and options on margin carries a high degree of risk and may result in losses exceeding your initial investment. These products are not suitable for all investors. Ensure you fully understand the risks and take appropriate care to manage your risk.
Patrick has been involved in the financial markets for well over a decade as a self-educated professional trader and money manager. Flitting between the roles of market commentator, analyst and mentor, Patrick has improved the technical skills and psychological stance of literally hundreds of traders – coaching them to become savvy market operators!